
Our Services
Customized Project Reports & Real-Time Insights for Smarter Decisions
Vitalis Analytics builds customized Power BI dashboards and reporting environments for the construction industry. We handle everything — data consolidation, modeling, design, and delivery. All we need are the exports your project already generates — no new software for the teams producing your data, no change to how they work.
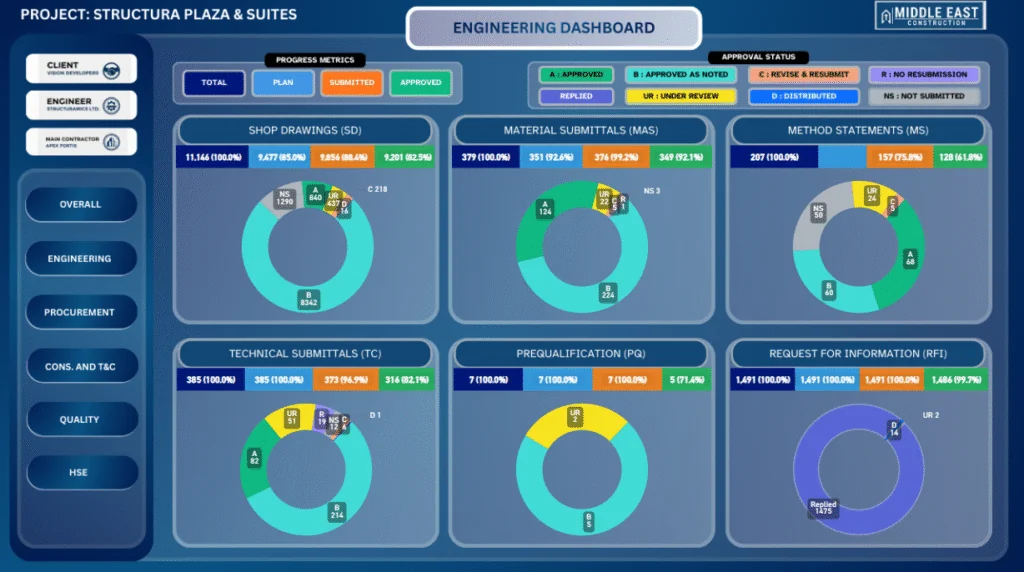
Precision Analytics – Tailored for Your Projects!
Executive & Portfolio Reporting
A single view across every project in your portfolio. Value-weighted completion against plan, project health status at a glance, financial summaries — contract value, earned, certified, forecast — and schedule variance, all on one screen built for leadership meetings and monthly reviews.
Construction Progress Reporting
Weighted physical progress across the full project lifecycle — Engineering, Procurement, Construction, and Testing and Commissioning. Planned vs actual comparison through S-curves and schedule variance, plus register-based tracking for engineering submittals, RFIs, procurement deliveries, quality records (NCR/SOR), and HSE statistics, with raised-vs-closed, aging, and overdue analysis across every register. Tracking runs through to closeout: snagging, documentation, and handover status followed to the end.
Forecasting & the Way Forward
Reporting that looks forward, not just back. Trend-based projections show where the project will land if current productivity continues. When progress slips behind plan, our forecasting views quantify the way forward: how much additional manpower is required, month by month, to complete the remaining work by the planned finish date. Schedule variance trends and overdue and aging analysis surface deviations early.
Custom Power BI Dashboard Development
No templates. Every dashboard is designed around your project’s reporting structure, your KPIs, and your stakeholders — from page layout to drill-down paths. Interactive filtering by project, discipline, and area, with detail pages behind every summary number. Role-based access built in: row-level security controls the data each group sees, and each stakeholder group’s app view opens to the pages relevant to them — management, engineering, procurement.
Data Consolidation & Modeling
We take over from the moment your data is exported — Primavera P6, Excel trackers, document-control registers, procurement logs — and consolidate it into one structured reporting model. Progress-weighting logic and KPI definitions are agreed up front, so every number in the report is traceable and defensible.
Automated Refresh & Report Distribution
A dashboard only creates value if people keep looking at it — and in practice, attention fades a few weeks after launch. That’s why our reporting comes to your stakeholders instead of waiting for them: scheduled email snapshots of your key report pages on your reporting cycle, and threshold alerts that trigger when something needs attention — overdue deliveries crossing a limit, progress slipping behind plan — each one linking through to the detail behind the number. Alerts reach people where they already look: email, and push notifications in the Power BI mobile app. Behind it all, scheduled refresh keeps every view current with your latest data, no manual updates.
Ongoing Reporting Support
Every build is delivered complete — your team owns the model and files, fully documented. For projects that need reporting to evolve — new phases, revised baselines, added registers — continuing support is available as a separate, scoped engagement.
Explore Dashboards Built for Real Project Challenges
We consolidate Primavera P6 exports, Excel trackers, and your project registers into unified dashboards with scheduled refresh. See the approach live in our dashboard examples, or request a consultation to discuss your project reporting.