VITALIS ANALYTICS
The Power Of Data:
Analyse → Act → Achieve
Dashboards designed to show a clear, real-time picture of multi project’s progress — from portfolio overview down to site-level detail.
Executive Portfolio Control
Unified CEO-level view across every project — real-time aggregation, multi-project status tracking, milestone analysis, and Earned Value Analysis for budget and cost control.
Engineering & Procurement
Centralised management of submittals and shop drawings, real-time RFI tracking, and Plan vs. Actual material delivery analysis.
Construction Progress
Progress % by site area and trade, accurate manpower forecasts, resource planning models, and labour efficiency and productivity metrics.
Quality & HSE
NCR and site observation tracking with closeout status, visual HSE compliance dashboards, risk mitigation models, and unified safety metrics with incident summaries.
Commercial & Financial
Real-time budget tracking, full payment application lifecycle from submission to certification, and variation order status with financial impact analysis.
Our analytics platform transforms complex project data into actionable insights, enabling teams to monitor performance, make informed decisions faster, maintain greater control, and deliver projects successfully.
Advanced Data Visualization
Interactive charts, KPIs, and mapping capabilities that make complex data instantly understandable.
Real-time Monitoring
Automated data refresh ensures you always have the latest project insights at your fingertips.
Efficient Data Handling
Seamlessly processes large datasets from Microsoft Excel, Primavera P6 sources, SharePoint/ OneDrive etc.
Mobile Access
Whether you’re in the office or on-site, our mobile-optimized dashboards keep everyone aligned and informed.
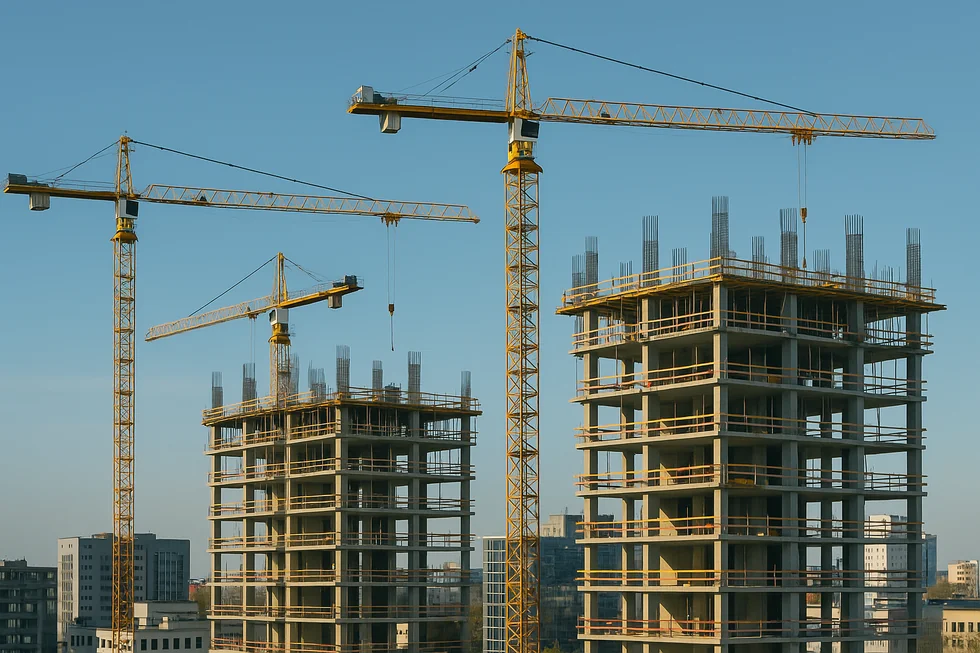
Building Projects
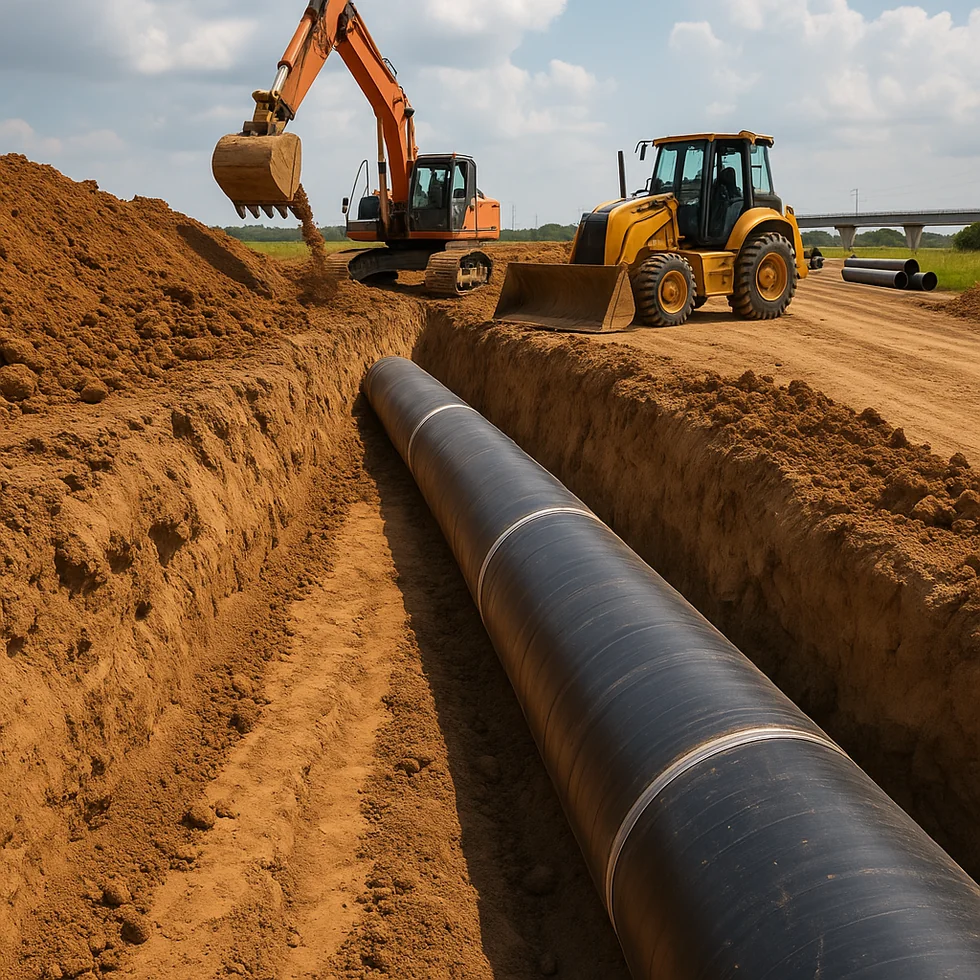
Infrastructure Projects